Back in March Frank Denneman wrote the following article about running PernixData FVP in Monitor Mode. I suggest that you read it before you read this post.
The great thing about monitor mode is that without the use of Flash or RAM for acceleration you will get a clear picture of how your storage array is performing. With the information gathered from this exercise you will know what to do next. Monitor mode will either let you choose to continue the POC with PernixData and start accelerating virtual machines. Or you may learn that your storage array got the performance you need. No matter the outcome you as administrator will know more about your environment and have learned about the IOPS profiles from your virtual machines.
I often get the question “What graph should I look at in monitor mode?”
A good place to start is the Summary graph on a Cluster level. This will show you information for all virtual machines latency running in that cluster. To start you should only add the two counters
– Datastore Read
– Datastore Write
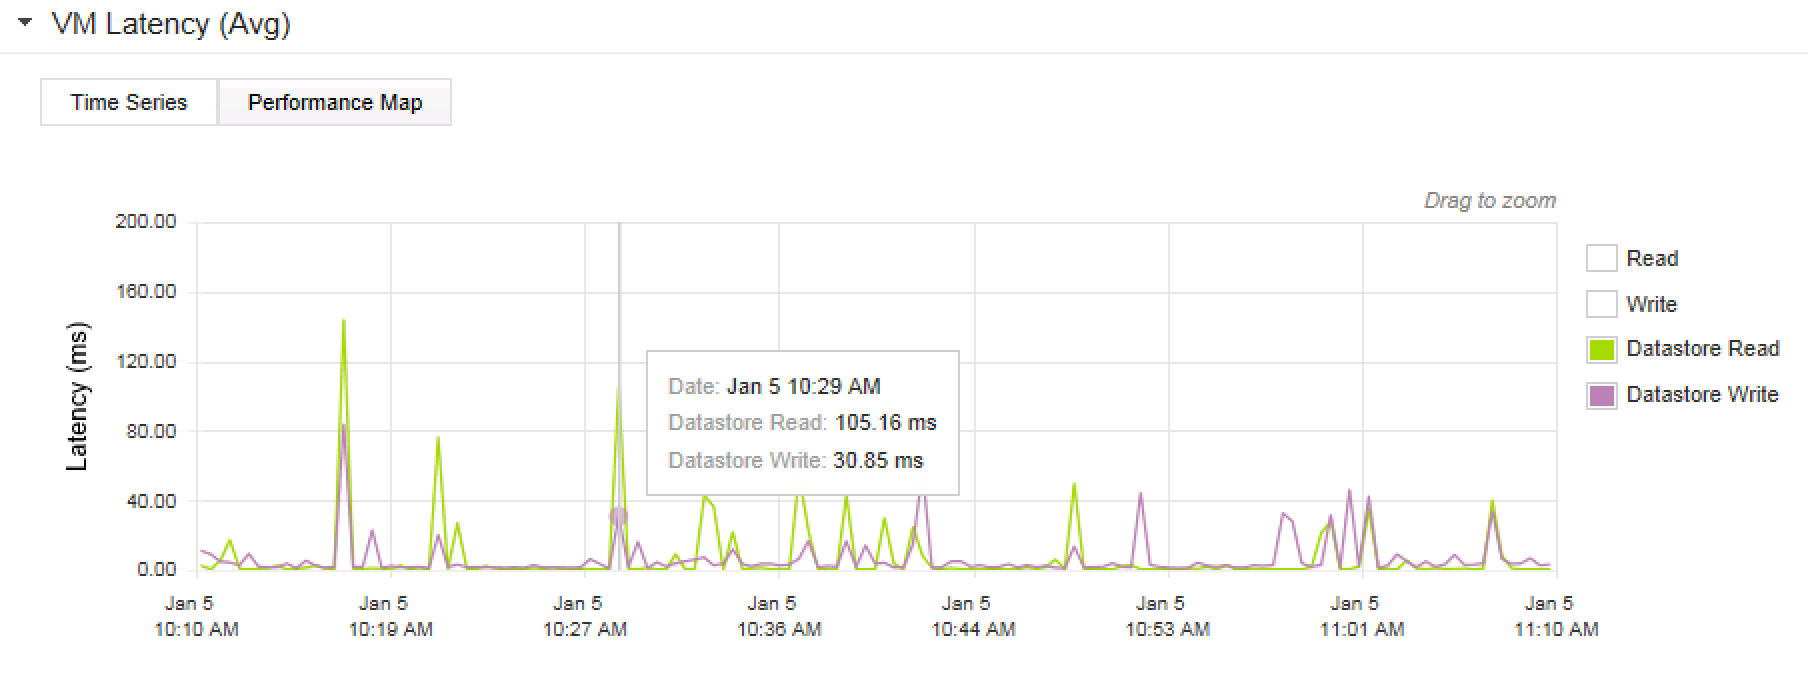
By looking at this graph you will get a quick summary of Read & Write latency the virtual machines are experiencing in your environment. At one data point in this graph we see a Read Latency at 105 ms. and Write latency of 30 ms.
When you see this there is no doubt that PernixData FVP will be able to help your virtual machines getting predictable low latency performance.
The next step is to try to accelerate your virtual machines. PernixData can use SSD, PCI-E flash or RAM for acceleration. When you choose you have two factors to think about
1. Performance of the acceleration media
2. Capacity
You want a good SSD/PCI-E flash device that gives you predictable low latency for read and write IOPS but you also want a drive with the right capacity. If the capacity is low you will not get the hit-ratio you are looking for. Capacity is a huge advantage for SSD/PCI-E over RAM. RAM is faster – but I would not sacrifice that capacity from a good performing SSD over RAM with lower capacity.
If we move on and start to accelerate with RAM/SSD/PCI-E you can then use the graphs again to show the difference.
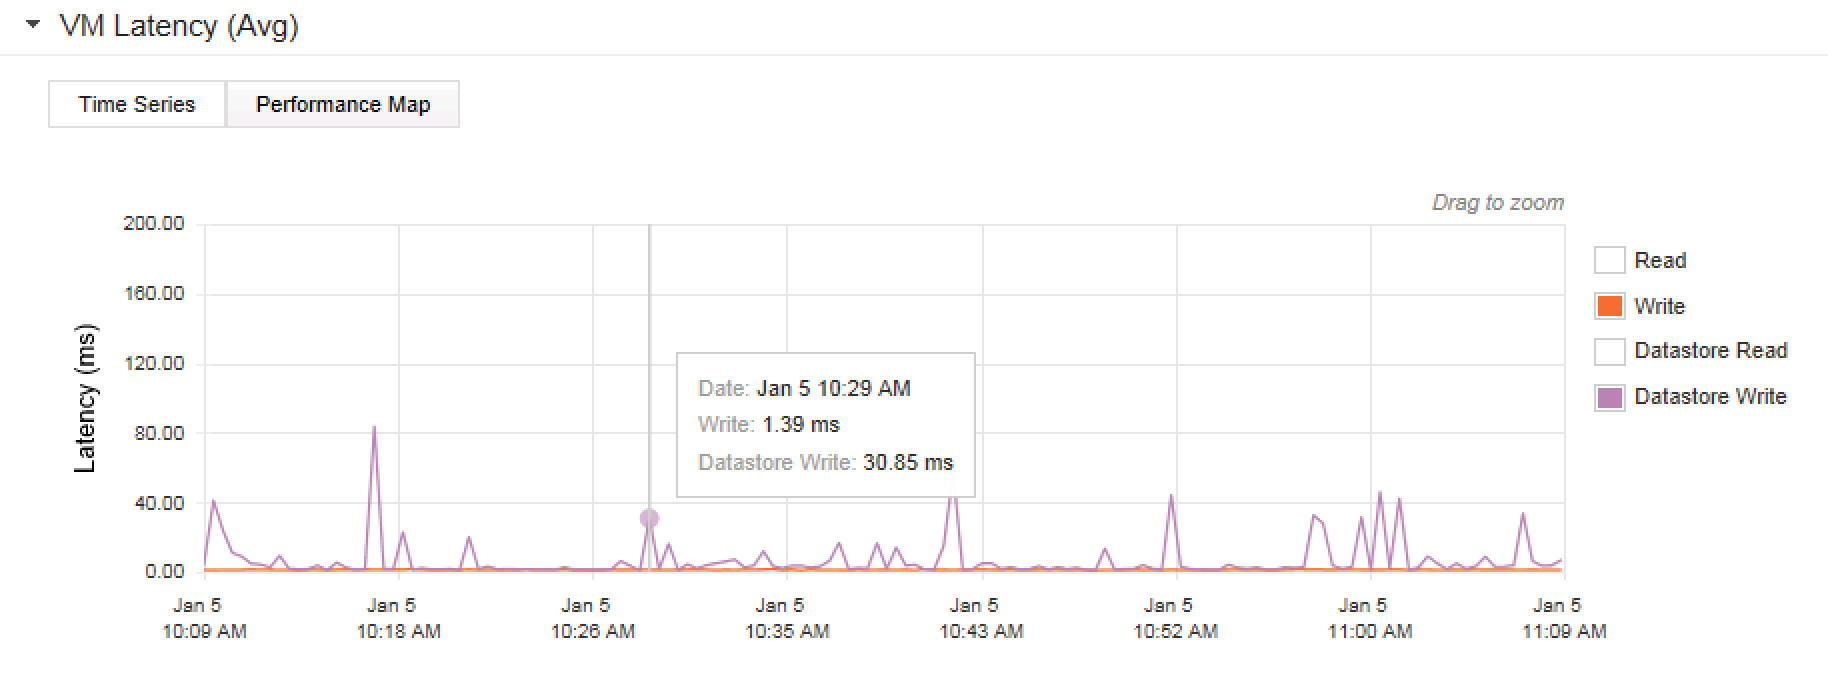
This picture shows the Datastore Write Latency and Write latency. Write equals VM Observed Write. So that latency is what the VM is experiencing. At the data point highlighted we have a datastore latency of 30 ms. but the VM is experiencing 1.39 ms because of local flash acceleration!
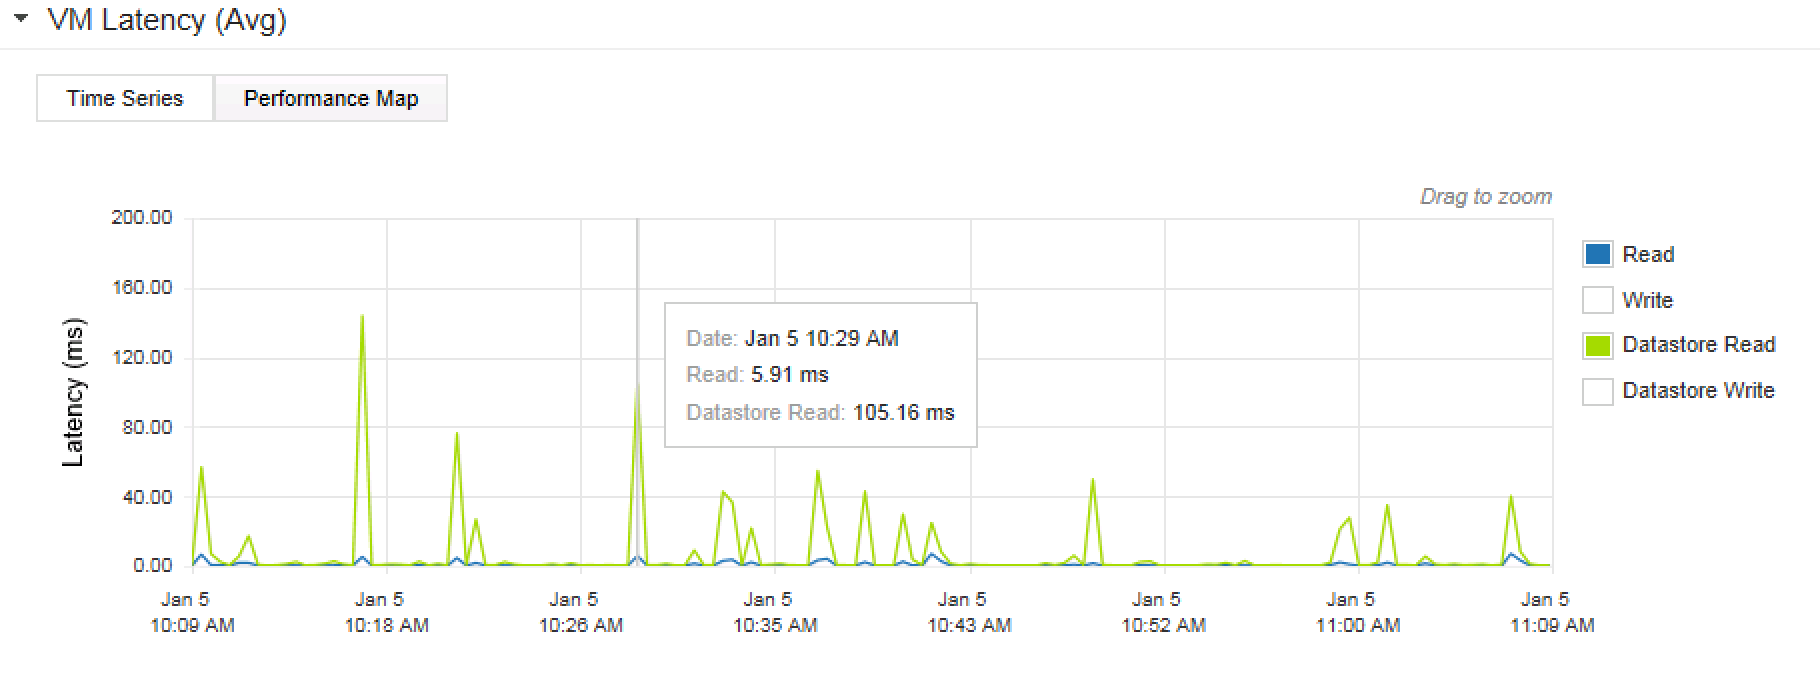
The next picture focuses on Read latency. The counters selected are Datastore Read & Read. The highlighted data point shows datastor latency at 105 ms but the VM is experiencing 5 ms because of local acceleration.
Monitor Mode is a strong tool to use during a PernixData FVP POC. It is not necessary to use it though. If you have flash/RAM available from the get-go you can still use the graphs to show what is going on. The graphs are right inside the vSphere Client or vSphere Web Client.
Once customers get FVP in their environment they don’t use the vCenter Performance graphs for storage performance anymore. They go straight to PernixData and uses them instead.
If you are interested in figuring out what storage Read & Write latency you are experiencing today. Then go and request a free trial version of PernixData FVP software here
[…] Running PernixData FVP in Monitor Mode This sounds really cool actually. Running FVP but not accelerating anything but rather just observing. But check out the article here. […]