VMworld Barcelona is only a few weeks away. I am very excited about joining my 19th VMworld! For the past 3 years I have been to VMworld working for Cohesity and I look forward to meet many friends from the community.
You are probably thinking about what Cohesity is planning this year at the show. Trust me it is going to be something you don’t want to miss. Here is the complete agenda: http://www.cohesity.com/vmworld2018/europe/
Tuesday night we are having an amazing party that you can register for here: http://events.cohesity.com/cohesitypartyBCN
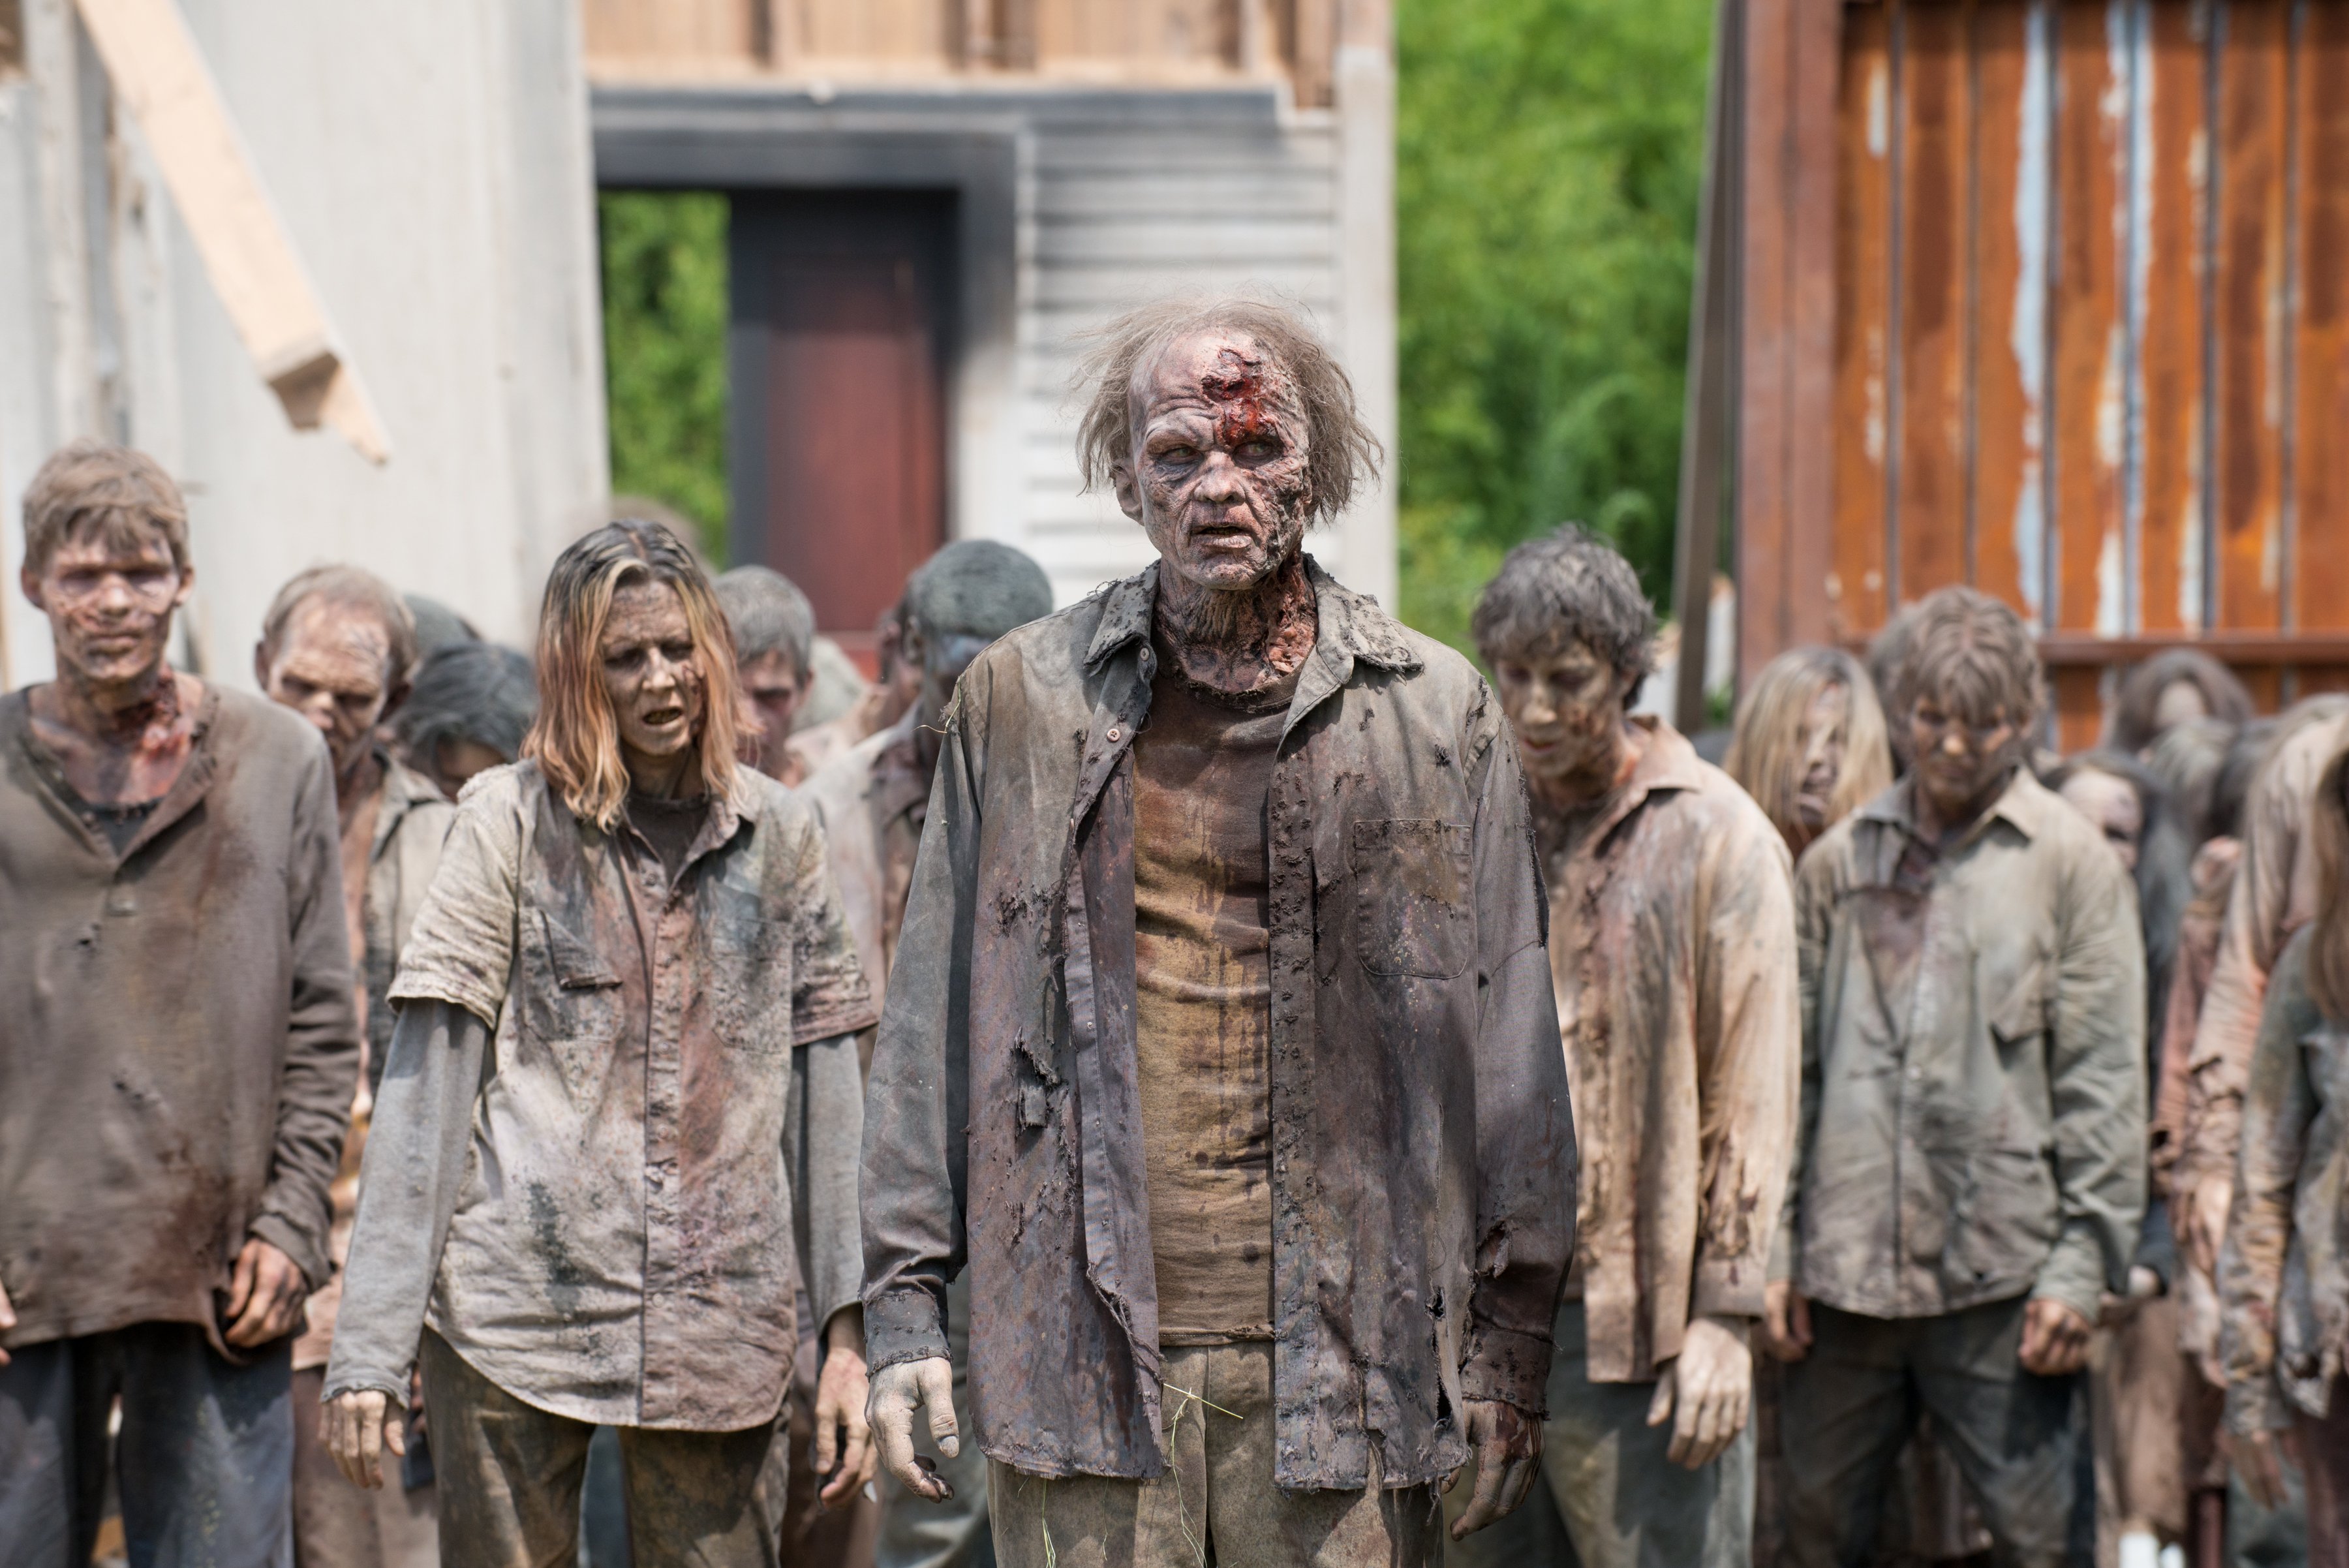
If you are a Queen fan don’t miss out! The Break Free Queen Tribute Show is the best in Europe.

The list of the VMworld’s I have participated in:
- 2007 – San Francisco
- 2008 – Cannes
- 2008 – Las Vegas
- 2009 – San Francisco
- 2010 – Copenhagen
- 2011 – Copenhagen
- 2012 – Barcelona
- 2013 – San Francisco (VMworld Speaker)
- 2013 – Barcelona (VMworld Speaker)
- 2014 – San Francisco
- 2014 – Barcelona
- 2015 – San Francisco
- 2015 – Barcelona
- 2016 – Las Vegas
- 2016 – Barcelona
- 2017 – Las Vegas
- 2017 – Barcelona
- 2018 – Las Vegas
- 2018 – Barcelona